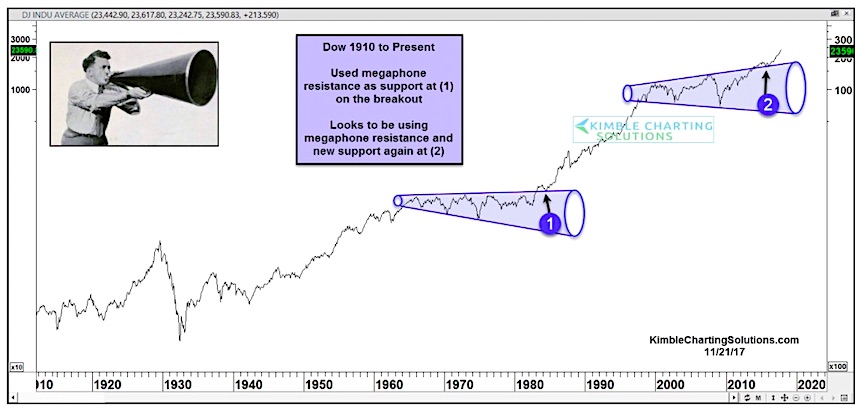
By analyzing these emerging movements, traders can identify potential points of entry and exit, as well as price targets, allowing them to make informed decisions about their positions in the market.


The pattern consists of at least two higher highs and two lower lows formed from five different swings. When a megaphone pattern emerges in a stock’s price chart, it indicates that there is uncertainty among market participants, causing fluctuations without a clear directional bias.

This formation provides traders with valuable insight into potential market trend reversals or continuations, and understanding how to trade them could result in profitable opportunities. As it widens over time, the pattern takes on the shape of a megaphone, hence its name.
This pattern signifies periods of high volatility and is characterized by the formation of higher highs and lower lows simultaneously. The megaphone pattern is a chart pattern that occurs in trading when price movement becomes volatile.